Database Management and Dashboard Construction
Over the past few weeks since the first blog we've covered a huge amount of material, which is really no surprise for an 8 week class. Though we move fast and furious through our material it never fails to be interesting, thought provoking, and applicable in fairly diverse ways. I noticed one of my classmates used Tableau to visualize the bodycount for HBO's hit bloodbath (show) Game of Thrones, and if that doesn't stand out like a novel application then I don't know what does! It's certainly inspiring me to attempted my own mapping of pop culture; probably something to with the character connections from one of those great, sprawling historical epics. Dickens maybe. Or The Wire. In the meantime, let's look back on what we've done so far.
In Week 2 we considered the Balanced Scorecard, which is essentially a framework with which to define business goals. A Balanced Scorecard helps define key performance indicators (KPI) and important metrics, and how to map organizational goals to them while keeping an eye on business strategy. Not just for business anymore, I'd be remiss to characterize it as solely useful for business goals, as a quick google search will preset so really fun applications of balanced scorecards to anything you can think of. Here's a Forbes article about applying a Balanced Scorecard to reviewing your own personal year in the life.
Also in Week 2 we dug into Data Warehouse design and the difference between OLTP and OLAP, which is a bit head spinning to say the least: Why must acronyms be so similar! OLTP, or Online Transaction Processing are relational databases like we learned in this class' prerequisite course, MIS 531. Dealing with current data, the OTLP reads, writes, and updates and uses those lovely relational tables the creation of which haunts my nightmares to this very day haha. By contrast OLAP, or Online Analytical Processing are databases that store current and historical data, and never really update (only periodically) to maintain that historical data. These are constructed via an entirely new process called a Star Schema, or Dimensional design which I'll talk about next.
So as I just mentioned, also in Week 2 we learned about Dimensional design. This was FASCINATING. Rather than having individual tables for data sets derived from a Relational model created from the business case, Dimensional design begins with a Star schema. A Star Schema is made up of a central fact table containing typically numeric and additive data (there are exceptions but we won't get that deep into the weeds here).
That Fact table is then surrounded by Dimension table, containing textual attributes and extensive content. The Fact and Dimension tables connect via foreign keys that are constructed for the sole purpose of Referencing. If we look at the image above, the time_key and item_key are said constructed foreign keys; they exist only to connect the tables.
In Week 2 we considered the Balanced Scorecard, which is essentially a framework with which to define business goals. A Balanced Scorecard helps define key performance indicators (KPI) and important metrics, and how to map organizational goals to them while keeping an eye on business strategy. Not just for business anymore, I'd be remiss to characterize it as solely useful for business goals, as a quick google search will preset so really fun applications of balanced scorecards to anything you can think of. Here's a Forbes article about applying a Balanced Scorecard to reviewing your own personal year in the life.
Also in Week 2 we dug into Data Warehouse design and the difference between OLTP and OLAP, which is a bit head spinning to say the least: Why must acronyms be so similar! OLTP, or Online Transaction Processing are relational databases like we learned in this class' prerequisite course, MIS 531. Dealing with current data, the OTLP reads, writes, and updates and uses those lovely relational tables the creation of which haunts my nightmares to this very day haha. By contrast OLAP, or Online Analytical Processing are databases that store current and historical data, and never really update (only periodically) to maintain that historical data. These are constructed via an entirely new process called a Star Schema, or Dimensional design which I'll talk about next.
So as I just mentioned, also in Week 2 we learned about Dimensional design. This was FASCINATING. Rather than having individual tables for data sets derived from a Relational model created from the business case, Dimensional design begins with a Star schema. A Star Schema is made up of a central fact table containing typically numeric and additive data (there are exceptions but we won't get that deep into the weeds here).
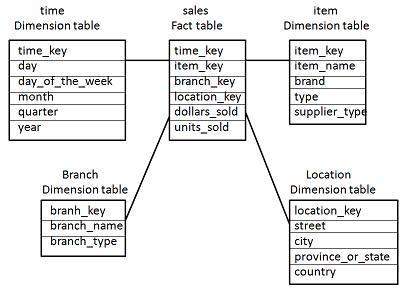 |
| Here's an example of a Star Schema |
This is a far cry from the ER databases I have gotten used to over the past few months, and though it was tricky to wrap my head around the Dimensional database, once I did I was an immediate fan. The connections between the tables make a ton of sense here, and don't require complex and confusing joins to pull information because they all share a single Fact table. These Dimensional databases are built for speed; they can pull up data fast than an ERDB and with better data integrity.
In Week 3 we dove deep into the weeds on Star Schema design and spent a bit of time on Data QA. This was definitely up my alley as I am a QA professional in my non-scholastic life. Data QA starts with profiling, which is a process to analyze the data for content, structure, and clarity. Essentially we need to make sure the data is sound; no missing values (or no damaging missing values), no issues with metadata, referential integrity (the ability for tables to connect probably) is correct, no data inconsistencies like excessive duplication. This process can also be used to learned about the business rules that govern the data which is an essential understanding for turning raw data into a database.
Finally we come to Week 4, which has been a blast so far (I am a nerd). We learned the fundamentals of Dashboard design, which essentially boil down to "less is more." When creating a Dashboard we need to be sure not to overwhelm the audience, not to use too many widgets and colors just to fill the space. It should be function over form but with an eye towards simple, elegant, easy to use design. I like to think of it as mid-century modern for the digital age.
 |
| I'm drooling, aren't I? |
Not to nerd out too much, but building my own Dashboard was probably my favorite project from this entire Graduate program. More than just about applying the skills we are learning, we were able to creatively utilize data and visualizations of our choice to convey what we can extrapolate from said data. I'm used to digging through data points to find the tendrils that lead to connections that then dump out extrapolations and interesting information, but I've never been able to put that to use in a visual medium. As someone with an appreciate for art and no innate talent and an obsession with information and data it was like getting to draw a portrait of pure knowledge. Flowery words? Sure. But the point is I enjoyed it, and I think my Dashboard came out pretty good.
I'll sign off for now. Drop me a comment guys! Let me know what you enjoyed most these last few weeks. Tell me about your Dashboard! Let's interact a bit!
 |
| You be the judge |
I'll sign off for now. Drop me a comment guys! Let me know what you enjoyed most these last few weeks. Tell me about your Dashboard! Let's interact a bit!

Comments
Post a Comment